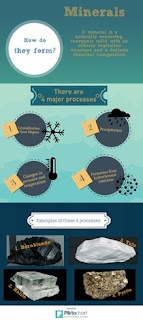
This week in my grad class we are learning about the visual learner. Today I took the time to learn about Infographics and a program called Pictochart to create a visual. Let me first explain what I learned is an infographic . Basically it is a graphic representation of information or knowledge that you want to share in visual form. You are able to share information quickly and clearly by using pictures, maps, signs, writing, etc in a visually appealing way.
Here is the Pictochart that I created. You can click on the link below to view.
My overall opinion of Pictochart
This program had many options to use. It also was very easy to use and understand quickly. If you clicked on something incorrectly it would give you a pop-up hint. There were many options to choose from to share your creation. You can share through social media, and email. Majority of the program is free. You do have a fee to pay if you want a pdf of your creation. I liked the fact that you can sign up using your google+ account. They had over 1,000 images to choose from or you could upload your own images. I did both in my creation. One thing that I did like was that they had ready made themes and templates that you could use. One downfall of this is that you have to make your creation public. The only way to have it private is to subscribe. I think one of the biggest things that I like about this web tool was that once I created my infographic I could turn it into a slide presentation. For example if you look at the photo above there would be 3 slides. This would make it very nice in presenting to the class. This would also make a great flyer to hang up in the classroom.
How does this affect visual learners?
Visual learning in my opinion happens in two ways. The student can visually see and learn from the information presented. The learner also gets a mental picture of the information. This can make it easy for them to process the information needed to learn. When your students are taking a test you can say "Do you remember the visual presentation we did on how minerals form?" for example. Instantly they get a mental picture and this helps them to recall what was presented.
In concluding as teachers we need to remember that students have different needs. They need to see, touch, and feel to learn!
Mrs._Scherry

Love the infographic, Scherry. I didn't know Piktochart turns into slides so easily. I'm going to have to try that.
ReplyDeleteYou will love that it turns into a slide! I was so excited that I could use this program in more than one way.
ReplyDelete